The Celigo image cytometer allows the user to capture whole-well images
- Imaging capability for suspension and adherent cells
- Generate whole well images for 6, 12, 24, 48, 96, 384, 1536-well plates
- Visually monitor labelled tumor target cells and the formation of immune complexes over time
Brightfield and four fluorescent channels for cell imaging and analysis
The Celigo™ image cytometer is a benchtop, plate-based, brightfield and fluorescent imaging system. The brightfield imaging capability, in combination with 4 fluorescence channels, provides high speed, fully automated imaging and quantification of suspension and adherent cells in 6, 12, 24, 48, 96, 384, 1536-well plates.
Using the Celigo image cytometer has significant benefits over traditional epi-fluorescent and brightfield microscopy. Visualize and capture whole-well images for an entire plate, perform automated cell counting and population analysis on a per well basis and significantly increase throughput by imaging a whole 96-well plate in less than 5 minutes.
The Celigo image cytometer captures whole-well images

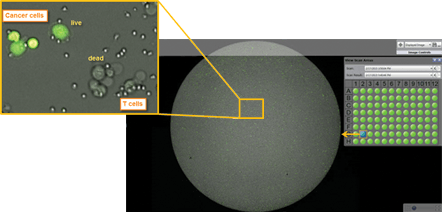
By acquiring high resolution whole-well images, we are able to image every cell in every well. Tumor target cells are stained with Calcein AM.
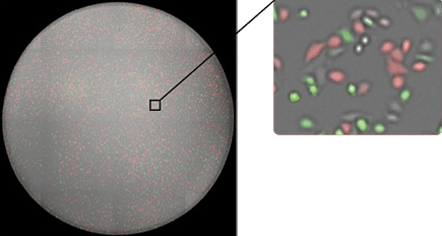
Whole-well image of GFP/RFP transfected HeLa
cells from a 96-well plate.
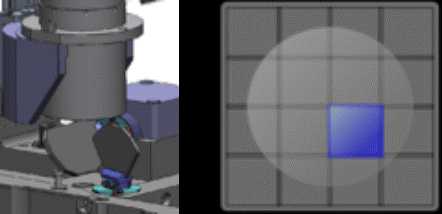
Proprietary optics and scanning system enable fast imaging of the entire well, while maintaining consistent illumination and contrast out to the well edge, for identification of all cells within each well.
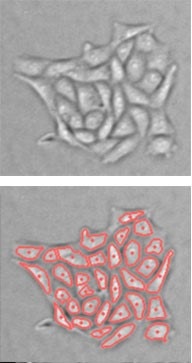
Adherent cells

Suspension cells
The Celigo can image both suspension and adherent cells in both brightfield and fluorescent modes.
Live cell analysis of E:T ratio-dependent NK cell-mediated cytotoxicity (Stained K562 cells imaged at t = 4 hr)
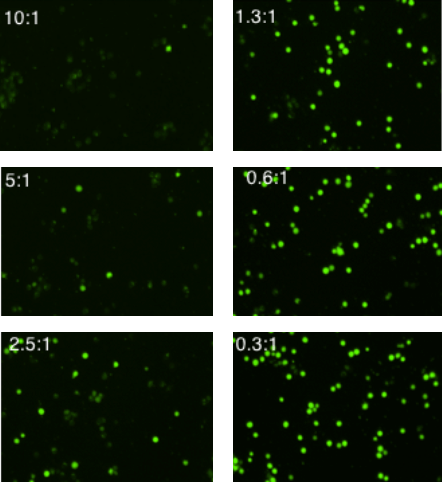
K562 cells stained with calcein AM are killed by effector cells in an
E:T ratio-dependent manner.
Live cell analysis of time-dependent NK cell-mediated cytotoxicity (NK to K562 Cell Ratio (E:T) = 2.5:1 )
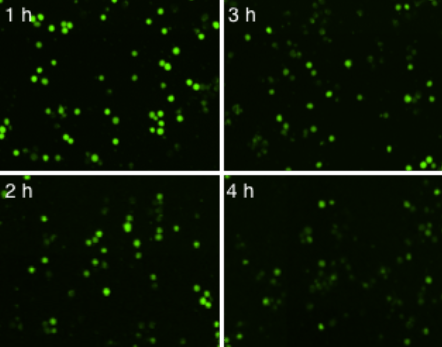
By imaging the sample plate over a period of 4 hours, we can observe the killing
of Calcein AM stained K562 cells by effector cells.
Time-dependent NK cell-mediated ADCC images

The number of Calcein AM positive target cells decreased as the incubation time increased with NK cells. The morphology of NK cells and target cells are visually different and it also showed that the NK cells cluster around the target cells to induce cytotoxicity.
Fluorescent images of cellular cytotoxicity at different E:T ratios
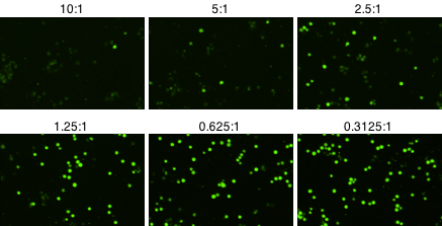
Imaged calcein AM stained target cells with different concentrations of effector cells. The number of live, Calcein AM positive cells decreases as the number of effector cells is increased.
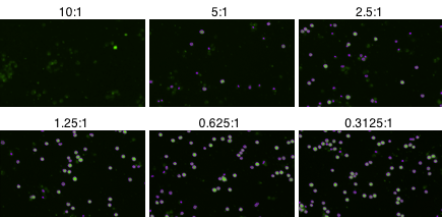
Counted fluorescent images of cellular cytotoxicity at different E:T Ratios
Live cell analysis and visualization of the formation of immune-complexes over time
Time

As time increased, the number of live target cells decreased.
Antibody concentration

As antibody concentration increased, the number of live target cells decreased. Additionally, with an increasing amount of antibodies, the number of immune cell clusters also increases..
For research use only. Not for use in diagnostic procedures.


