


Introduction to surface and intracellular proteins markers
Surface and intracellular proteins are markers that are important for identifying specific type of cells and characterizing cell populations. Traditionally, these assays are performed on flow cytometers. More recently, image-based cytometry method has been utilized for many standard surface and intracellular protein detection assays to provide a simpler and more rapid method for cell population analysis. The Cellometer Vision CBA* image cytometer performs surface marker and intracellular protein fluorescence analysis to characterize cell populations. Below are examples of assays that have been performed using the Cellometer image cytometry method.
*This section refers to the Cellometer Vision CBA image cytometer which has been superseded by the Cellometer Spectrum system.
Human Activated T Cell – CD44-APC
Human T cells were stained with APC conjugated anti-CD44 and imaged on the Cellometer Vision CBA. The counted brightfield image shows T cells automatically identified by the Cellometer software and outlined in green color. The fluorescent APC image shows red surface marker staining of positively stained T cells. The mean fluorescent intensity values for each cell were exported to flow cytometry software FCS Express™ and plotted as a histogram. The gated data shows that more than 95% of the cells were positive for CD44.
Brightfield counted image
Fluorescence image
Human Activated T Cell – CD44-PE
Similar to the experiment above, Human T cells were stained with phycoerythrin (PE) conjugated anti-CD44 and imaged on the Cellometer Vision CBA. The counted brightfield image shows T cells automatically identified by the Cellometer software and outlined in green color. The fluorescent PE image shows orange surface marker staining of positively stained T cells. The mean fluorescent intensity values for each cell were exported to flow cytometry software FCS Express™ and plotted as a histogram. The gated data shows that more than 95% of the cells were positive for CD44.
Brightfield counted image
Fluorescence iImage
Macrophage in mouse bone marrow – CD11b-PE
Primary bone marrow sample was stained with PE conjugated anti-CD11b, a cell surface receptor found on the surface of several cell types including mononuclear phagocytes a.k.a macrophages. Twenty microliters of the stained sample were imaged on the Cellometer Vision CBA system. The green circles shown in the brightfield image represent automatically counted and outlined mononuclear cells. The fluorescent image shows bright staining profile of cells that are positive for CD11b. The mean fluorescent intensity values for each cell were exported to flow cytometry software FCS Express™ and plotted as a histogram. The gated data shows that about 84% of the cells are positive for CD11b.
Brightfield counted image
Fluorescence image
Human jurkat cells – CD3-PE
Cultured Jurkat cells were stained with PE conjugated anti-CD3 surface marker and imaged on the Cellometer Vision CBA. The counted brightfield image shows Jurkat cells that were automatically identified by the Cellometer software and outlined in green color. The fluorescent PE image shows orange surface marker staining of CD3 positive Jurkat cells. The mean fluorescent intensity values for each cell were exported to flow cytometry software FCS Express™ and plotted as a histogram. The gated data shows that more than 80% of the cells were positive for CD3.

Brightfield counted image
Fluorescence image
Human PBMC – CD3-FITC
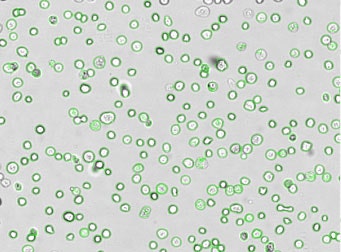
Primary peripheral blood mononuclear cell (PBMC) sample was stained with FITC conjugated anti-CD3 surface marker and imaged on the Cellometer Vision CBA. The counted brightfield image shows cells that were automatically identified by the Cellometer software and outlined in green color. The fluorescent FITC image shows green surface marker staining of CD3 positive mononuclear cells. The mean fluorescent intensity values for each cell were exported to flow cytometry software FCS Express™ and plotted as a histogram. The gated data shows that nearly 90% of the cells were positive for CD3.
Brightfield counted image
Fluorescence image
Human PBMCs – CD3-PECy5
Similar to the CD3-FITC experiment above, a primary peripheral blood mononuclear cell (PBMC) sample was stained with anti-CD3 PE-Cy5 conjugated tandem dye and imaged on the Cellometer Vision CBA. Note that this tandem dye is a combination of phycoerythrin (PE) and cyanine (Cy5), has a broad emission spectra and was imaged using the APC filter module. The counted brightfield image shows cells that were automatically identified by the Cellometer software and outlined in green color. The fluorescent image shows a reddish surface marker staining of positively stained mononuclear cells. The mean fluorescent intensity values for each cell were exported to flow cytometry software FCS Express™ and plotted as a histogram. The gated data shows that about 65% of the cells were positive for CD3.
Brightfield counted image
Fluorescence image
Human PBMCs – CD19-PECy5
A primary peripheral blood mononuclear cell (PBMC) sample was stained with anti-CD19 PE-Cy5 conjugated tandem dye and imaged on the Cellometer Vision CBA. Note that this tandem dye is a combination of phycoerythrin (PE) and cyanine (Cy5), has a broad emission spectrum and was imaged using the APC filter module. The counted brightfield image shows cells that were automatically identified by the Cellometer software and outlined in green color. The fluorescent image shows a reddish surface marker staining of positively stained B-cells. The mean fluorescent intensity values for each cell were exported to flow cytometry software FCS Express™ and plotted as a histogram. The gated data shows that about 10% of the cells were positive for CD19 B-cells.

Brightfield counted image

Fluorescence image
Mouse cells – Mouse IgG-FITC and RFP
Brightfield counted image
Fluorescence image

Fluorescence image
CD44 – PE
Brightfield counted image

Fluorescence image
Human lymphocytes – CD4-PE
Mouse thymocytes – CD8-PE and CD4-APC
Mouse splenocytes – CD8-PE and CD4-APC
MHC Dextramer – CD8-FITC and Dextramer-PE

Human T cells and cytokines – CD8-PE and INFg-FITC
Intracellular proteins for protein pathway research
Various complex proteins exist in cells that are generated or removed by cellular functions. These proteins can be used as an indicator to measure certain protein pathways or functions of the cells to determine if they are operating normally or abnormally. These intracellular proteins can be fluorescently labeled and measured by the Cellometer Vision CBA image cytometer to determine the cell population associated with these proteins.
Heat shock protein in MNNG cancer cells – HSP90-PE and GFP
Brightfield counted image
Fluorescence image
Fluorescence image
Heat shock protein in MNNG cancer cells – Grp78-Alexa fluor 594 and GFP
Brightfield counted image
Fluorescence image
Fluorescence image
Stem cell analysis for regenerative medicine
Stem cell markers are often used to determine the stem cell population in blood, cord blood, bone marrow, and adipose tissue. These cells are important for research in regenerative medicine, and the ability to quickly characterize a stem cell population in a cell sample can greatly improve research efficiency. The Cellometer Vision CBA image cytometer can be utilized to measure cell population of some of the common stem cell markers.
Mouse iPS cells – SSEA-1-PE
Brightfield counted image
Fluorescence image
Human iPS cells – SSEA-4-PE
Brightfield counted image
Fluorescence image
Human iPS cells – TRA-181-PE
Brightfield counted image

Fluorescence image
CACO2 cancer stem cells – CD133-FITC
Brightfield counted image

Fluorescence image
For research use only. Not for use in diagnostic procedures.