
Whole-well imaging for reliable counting of non-uniform cell populations

Monitor cell growth and perform live cell analysis of proliferation using label-free brightfield imaging
Brightfield images showing cell proliferation
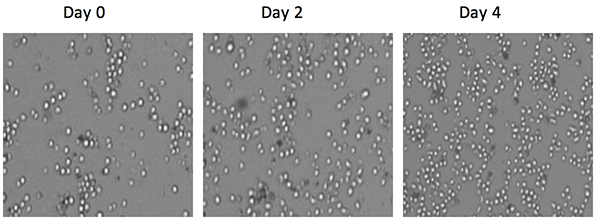
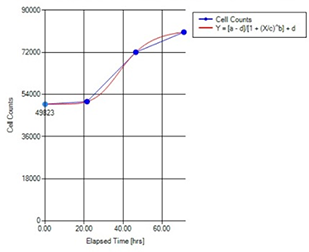
During a proliferation assay, the number of cells increased from 49323 cells on day 0 to 80621 cells on day 3 (curve on right).
Monitor cell proliferation over time
Live cell analysis of total and PI-positive suspension cells at an increasing drug concentration
| Well | D2 | D4 | D8 |
|---|---|---|---|
| BF | 87925 | 57718 | 39107 |
| PI(+) | 2654 | 7520 | 13171 |
| Viability | 96% | 87% | 66% |
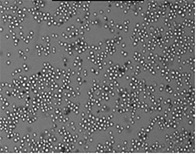
The number of PI-positive cells increased in a drug dose-dependent manner.
Well D2

Well D4
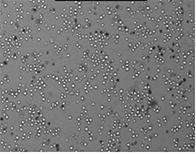
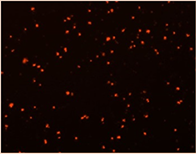
Well D8
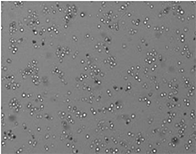
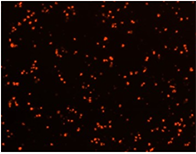
96-well based cell counting assay for microscale screening platform for CHO cells
Assay protocol
- Use optical quality 96-well plate
- Make master dye containing Hoechst 33342 and propidium iodide
- Load 200 µl of master dye mix per well
- Add 3 µl of CHO cell suspension per well
- Incubate 40 min at room temperature
- Image 96-well plate on Celigo image cytometer (blue and red fluorescence channels)
- Use “Direct Cell Counting” image analysis parameters for Hoechst+ and PI+ cells
- Count all cells in each well
- Obtain live cell density using live cell count: Hoechst+ – PI+
- Obtain viability: (Hoechst+ – PI+)/Hoechst+
Direct cell counting using image analysis for Hoechst+ and PI+ cells
CHO cell images

CHO cell images in the blue channel, red channel, merged image and counted cell image.
Experiment 1:
A dilution series of exponentially growing healthy CHO-S cells was prepared and the viable cell density (VCD), coefficient of variation (CV) of VCD of healthy CHO-S cells was examined.
Comparison of viable cell density using a 96-well based Celigo method to one-sample based cell counting method
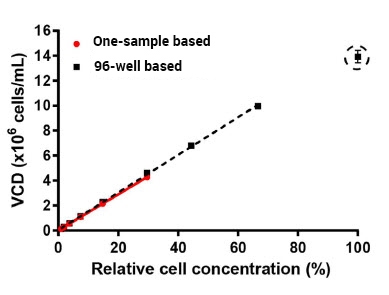
Viable cell density is plotted against relative cell concentrations for the 96-well based and one-sample based method. The dashed black line from linear regression of 96-well based method (R2 = 0.999).
Comparison of CV of VCD using a 96-well based Celigo method to one-sample based cell counting method
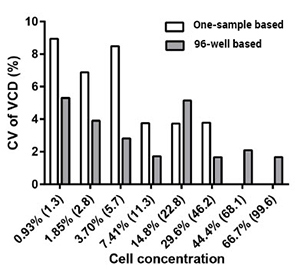
The coefficient of variation of VCD measurements is plotted against the measured cell concentration using a 96-well based and one-sample based method.
Viability of CHO-S cells does not change due to cell concentration in 96-well based and single sample based samples
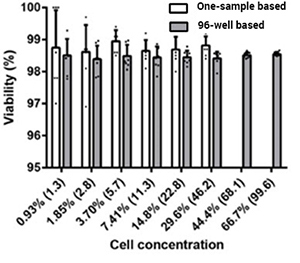
Percent viability is plotted against the measured cell concentration using the Celigo 96-well based and one-sample based method.
Experiment 2:
Cells at two concentrations were treated with endoplasmic reticulum (ER) stress inducer tunicamycin to produce a sample with lower viabilities.

The viability and VCD decreased in a dose-dependent manner for both 96-well based and one-sample based method.
Conclusion
96-well based method versus the one-sample based method showed excellent correlation in VCD, CV of VCD, and viability measurement. Based on the performed cell dilution series, 96-well based method has a counting range from 1×10⁵ to 1×10⁷ live cells/mL.
Citation
Hansen HG, Nilsson CN, Lund AM, et.al. (2015) Versatile microscale screening platform for improving recombinant protein productivity in Chinese hamster ovary cells. Scientific Reports 12 (5):18016
For research use only. Not for use in diagnostic procedures.


