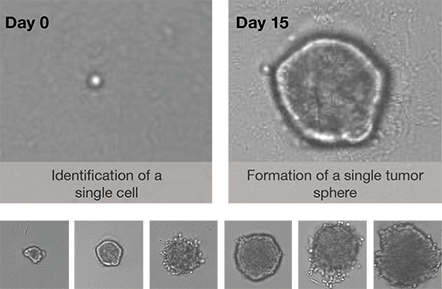
Monitor the tumor sphere formation from a single cell to a single sphere in microwell plates
A single cell is seeded per well and the formation of a tumor sphere is monitored over the next 15 days using the Celigo™ image cytometer and the tumor sphere application. The Celigo captures whole-well images on day 0 to document the presence of 1 cell per well. This data is used to verify that the formation of the sphere originated from a single cell.
Quantification of tumor sphere size
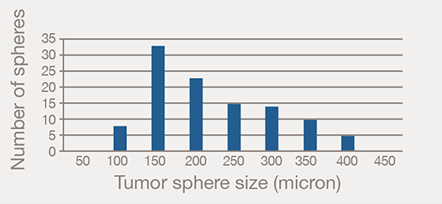
On day 15 the entire 96-well plate is imaged and the tumor sphere size is automatically analyzed. The size distribution graph on the right shows a variation of tumor sphere sizes, (100 – 400 microns) that arose from single cell clones seeded on day one. The Celigo-captured images (below) show the great variation in formed tumor sphere size and morphology

Tumor sphere formation

Tumor sphere generated from single cell size distribution
For research use only. Not for use in diagnostic procedures.


