Cell line development – Single cell detection, clonal validation, transfection
Cell line development process
The process of developing a cell line to produce a specific protein or antibody involves multiple stages, all of which can be greatly aided by Celigo image cytometer.
Transfection
- Determine transfection efficiency
- Monitor stability of transfection
Stabilized Outgrowth
- Monitor growth in wells
- Identify confluent wells for passaging
- Increase growth with media optimization
Monoclonality
- Verify efficiency of limiting dilution, or single cell dispensing
- Identify single cell per well
Colony Outgrowth
- Confirm single colony

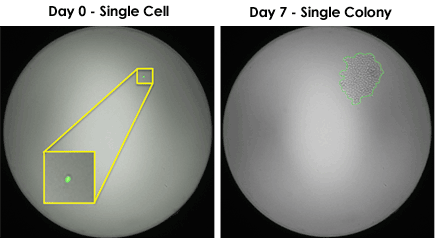
Whole well images: Single cell to single colony
Robotic integration for cell line development
The Celigo provides an optional robotic API which can be controlled by various automation scheduling software applications. The Celigo is ready for integration with multiple automation partners and can be coupled with robotic arms, automated incubators and liquid handlers.
The Celigo can be used through the whole process of cell line development.
- Compatible with 96-, 384- and 1536-well plates.
- Identify wells with a single colony to avoid the time-consuming and manual identification of clones by eye.
- Measures colony size using brightfield and aids the process of selecting wells for clonal expansion.
- Automate cell line generation process with Celigo robotic integration.
Cell line characterization

Brightfield imaging
Brightfield images can be viewed from the cell, well or plate level.
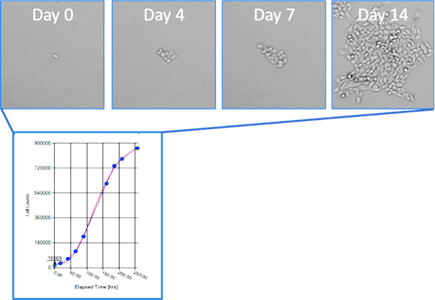
Determine growth characteristics of cells directly from the same well over time.
Acquire, review and document captured hi-res brightfield images
Generate growth curves
Report growth curves, cell counts, confluence, doubling time and doubling rate for each well.
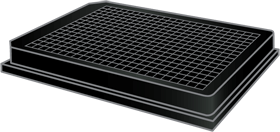
384-well plate
Media optimization experiment using a single 384-well plate
- Providing additional nutrients to media can help increase proliferation rates.
- Evaluated media supplements using an 8-parameter design of experiment (DoE) methodology, where 3 reagents were mixed in multiple combinations.
- On day 0, 10 CHO-S per well were plated with supplement combinations using a 384-well plate, which allowed 35 replicates per condition.
- Three supplement reagents were tested on one 384-well plate for n=35 per condition
Monitoring monoclonality and outgrowth
Adherent Cells
Suspension Cells
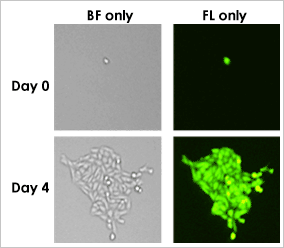
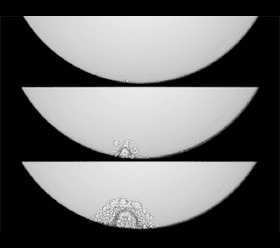
Dual-channel brightfield and fluorescent imaging of a single cell in a 96-well plate allows identification of candidate wells for clone development.
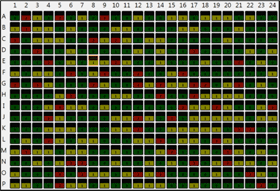
Single Cell Fluorescent Counts
Identify wells with a single cell on the first day
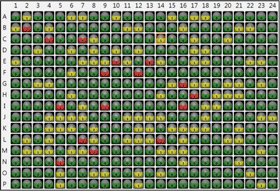
Single Colony Brightfield Counts
Identify wells with a single colony on the final day
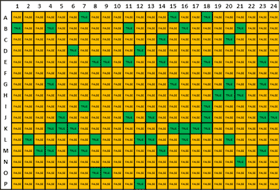
Heat Map: Single Cell & Single Colony
Overlay single cell plate map with single colony plate map to produce the heat map of a single cell and single colony.
For research use only. Not for use in diagnostic procedures.


