Overview of viability and necrosis
Measuring viability and necrosis are an important component of pharmaceutical and academic research. Identifying viable cells in harvested primary samples and in tissue cultured cells provides researchers the ability to determine the condition of their samples. Furthermore, the ability to quickly determine the cytotoxic effect of chemical compounds on cancer cells allows researchers to efficiently identify potential drug candidates for further development.
Necrosis is most often characterized by irreversible cellular damage which includes: cytoplasmic swelling, permanent cell membrane damage, organelle breakdown, and eventually the release of cellular contents into the surrounding medium.
In non-viable cells, the loss of cellular membrane integrity allows for membrane exclusion dyes such as propidium iodide (PI), ethidium bromide (EB), 7AAD, SYTOX green/red, and others to freely diffuse into the cell and bind to its DNA. Because these dyes only enter cells with compromised cell membranes, early apoptotic and healthy cells will not be stained, while dead or dying cells will be stained. The emitted fluorescent signal can be captured by a Cellometer cell counter and an image generated. Both brightfield and fluorescent images are captured and enumerated by the Cellometer instrument.
Sample detection using Cellometer
Detection of cell viability and necrosis using Cellometer spectrum or K2
With the Cellometer Spectrum or K2, 20 µl of sample is added to the Cellometer counting chamber. Imaging and analysis of the sample is completed in less than 30 seconds. Brightfield and fluorescent cell images can be viewed to check cell morphology and verify cell counting. Total cell count, concentration, and mean diameter are automatically displayed.

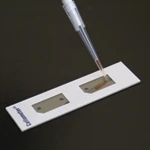
1. Pipette 20 µl of sample into a disposable slide
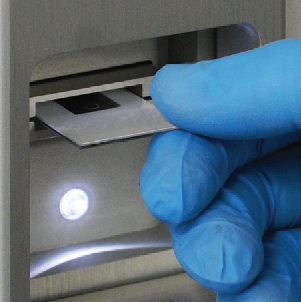
2. Insert slide into the instrument
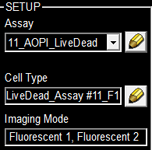
3. Select assay from a drop down menu
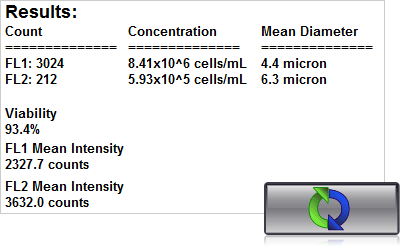
4. Click count, acquire image and view cell count, concentration, diameter
Detection of cell viability and necrosis using Cellometer Auto 2000

1. Pipette 20µl 2. Insert slide 3. Select assay & click count 4. Results in 30 seconds!
Temperature induced necrosis
Jurkat cells were exposed to various temperatures for 20 minutes and stained with propidium iodide. At 37 °C, the standard incubation temperature, cells remained healthy and very few necrotic cells were detected. The viability of the sample was determined to be 93.8 %. As the temperature was increased the percent of PI positive cells increased from 6.2% at 37 °C to 89.8% at 60 °C.
Jurkat cell images
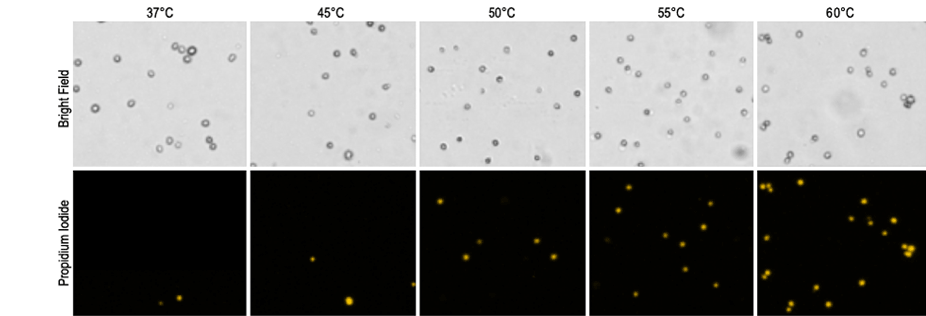
| 37°C | 45°C | 50°C | 55°C | 60°C | |
|---|---|---|---|---|---|
| Brightfield | 1237 | 1312 | 1099 | 1410 | 1097 |
| PI positive | 79 | 169 | 176 | 623 | 983 |
| Viability | 93.8% | 87.2% | 84.0% | 55.8% | 10.2% |
For research use only. Not for use in diagnostic procedures.


