


Introduction to WBCs from peripheral blood
As one of the most important cellular components in peripheral blood, the concentration of white blood cells is routinely used in researching various diseases, such as bacteria/virus infections, leukemia, or leucopenia. Conventional methods to count white blood cells include a time consuming and tedious red blood cell (RBC) lysis process.
Fluorescent staining can be used to simplify traditional methods by mixing a cell membrane permeable DNA dye (acridine orange and propidium iodide) with diluted whole blood sample that specifically stains white blood cells. This is an ideal solution for many complex cell population characterization assays such as rapidly counting white blood cells in whole blood. Revvity’s Cellometer automated cell counters are able to quantitatively analyze WBCs by simply pipetting 20 µl of treated sample into a Cellometer disposable chamber (in a counting slide) and placing the slide into the instrument. Since the counting slide is disposable, no washing is required between samples, there is reduced risk of cross contamination of different samples, and the risk of exposure to biohazard materials is reduced.
Using proprietary algorithms, the Cellometer’s robust operating software analyzes cell images, and generates counting data, typically in less than 60 seconds. Cell images and analysis data, including cell size distribution histograms, can be saved for documentation. Data can also be easily exported to Microsoft Excel spreadsheets for further analysis.
AOPI Stained PBMC Sample
Live nucleated cells are stained with AO (green) and dead nucleated cells are stained with PI (red).
AOPI Stained PBMC Sample
Live nucleated cells are stained with AO (green) and dead nucleated cells are stained with PI (red).
Cellometer counting results
Counting results box displays fluorescence cell count & concentration.
Method
Direct AO/PI labeling of white blood cells:
- Collect the peripheral blood sample (20 – 50 µl).
- Take 20 µl of blood sample and dilute the sample in 180 µl of PBS.
- Mix 100 µl of Acridine Orange/Propidium iodide (AO/PI) solution to 100 µl diluted blood sample.
Running assay
- Load 20 µl of sample into the disposable counting slide chamber
- Insert slide into the Cellometer automated cell counter
- Select Assay from drop-down menu
- Enter Sample ID for this sample
- Preview cell images and click ‘Count’ to begin analyzing sample
- Review images and counting data.
- Save or export images and/or report data.
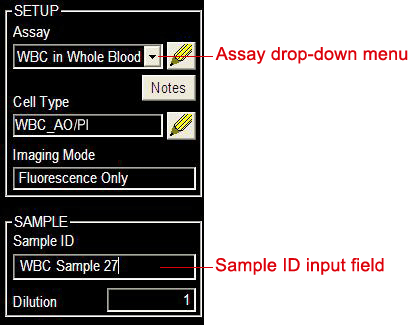
Cellometer software assay set up
Results
AO-stained WBCs are clearly visible in the acquired fluorescent image. The software indicates counted cells with a green circle (enlarged to show detail). The results display indicates the fluorescence cells counted and automatically calculates the concentration.
Fluorescent images showing AO stained WBCs (left) and counted WBCs circled in green (right). RBCs are not visible.
Cell and fluorescent size distribution histograms, scatter plots and data files can also be automatically generated. All experimental data can be instantly transferred to an Excel spreadsheet or saved in a data table.
Excel spreadsheet
Example of data output to Excel.
Data table
All counting results can be automatically saved to a data table.
For research use only. Not for use in diagnostic procedures.