What are cytopathic effects?
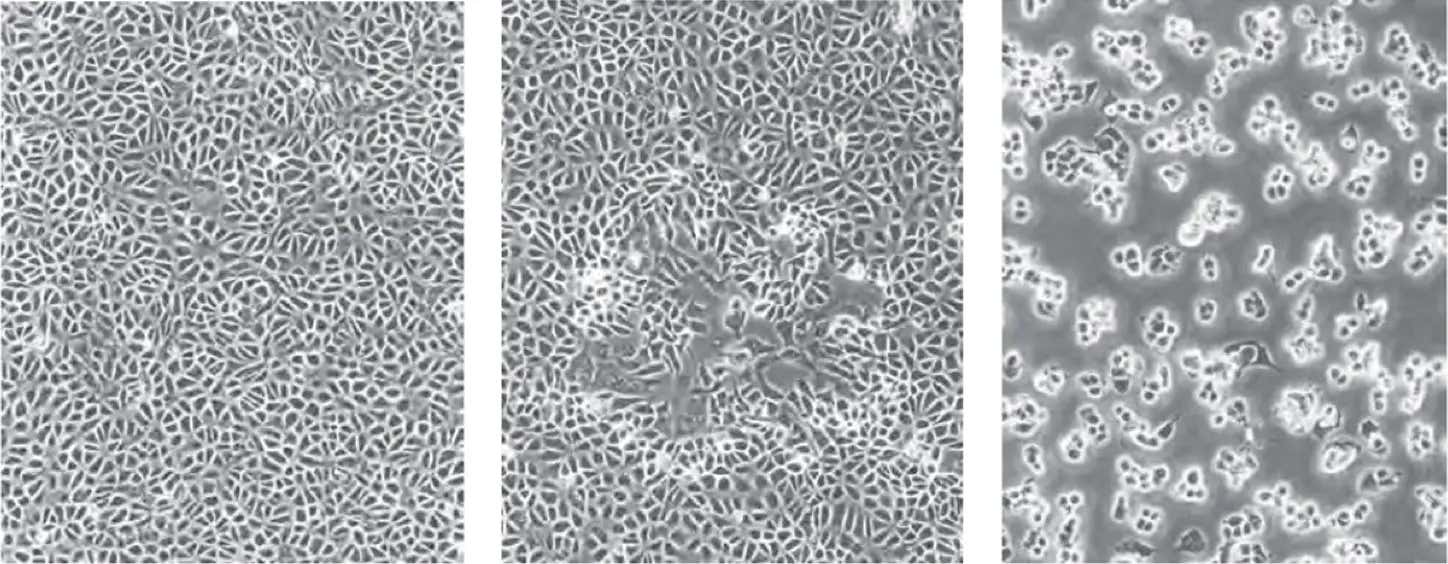
Cytopathic effects (CPE) are indicated by the changes in host cell morphology which are caused by the target infecting virus [Medical Microbiology. 4th edition. Chapter 44 Effects on Cells]. The common visual observations of the host cells are swelling or shrinkage, rounding, lysis, plaques, clumping, syncytia, and inclusions. In general, viruses with the ability to cause degeneration of the host cells are called cytopathogenic. There are varying degrees of cytopathic effects caused by different viruses, where some can completely and rapidly destroy host cell monolayer while other viruses alter the morphology of the host cells [Erica Suchman, Carol Blair. 2007. Cytopathic effects of Viruses Protocols].

BSC40 cells (left), moi <0.01 pfu/cell 48 hours after infection (center), moi=10 pfu/cell (right)
What makes a good cytopathic effect assay?
There are several critical factors that need to be considered to set up and perform a good cytopathic effect assay. The list below shows the factors and reasons why they are important for cytopathic effect assay development.
- Host cell seeding density – It is critical to seed enough host cells to quickly grow and cover the surface of the well, which allows better visualization of the cytopathic effect when it occurs. If the confluence of the host cells is not near 100%, then there will be some uncertainty as to whether the virus has induced cytopathic effects.
- Virus concentration – It is important to perform a viral titer experiment prior to the cytopathic effect assay to determine the proper range of the virus concentrations to obtain the appropriate TCID50 results.
- Throughput – Utilizing the plate-based image cytometry method, the assay throughput can be increased from the standard 6 – 24-well plates to 96 and 384-well plates.
- Imaging – Image cytometry can rapidly scan whole wells of the entire plate to digitally capture brightfield and fluorescent images for analysis, unlike the conventional microscopy method, which requires manual observation of the cytopathic effects and lacks digital records.
- Analysis – Image analysis algorithms can automate the identification of cytopathic effects via the destruction of cell monolayer, reduction in host cell count, and morphological changes at an individual cell level. In contrast, traditional cytopathic effect assays require trained technicians to visually inspect and identify, which is tedious, time-consuming, and generates a high level of uncertainty.
Cytopathic effect – direct analysis using the celigo image cytometer
The Celigo image cytometer can rapidly analyze cytopathic effects by imaging the entire microplate in brightfield and fluorescence. Using the built-in image analysis software, the Celigo can quickly generate counts of plaques, foci, and individual infected cells, morphological measurements, as well as fluorescent intensity. It can analyze the cytopathic effect using different image analysis and counting methods that are tailored to the virus and host cell pairing. Scientists can perform high-throughput automated imaging and analysis of the cytopathic effect in plates using brightfield imaging without any labeling.
- Speed: Less than 10 min/plate with our automated image acquisition and analysis tools
- Innovation: Count infected cells and total cells in every well without trypsinization
- Faster results: Earlier plaque detection reduces assay duration
- Single system: Automated brightfield and fluorescence-based counting for focus formation assay
- Convenience: Integrate a plate stacker with up to 50 plates analyzed per day
The Celigo image cytometer software includes proprietary image analysis algorithms dedicated to virology applications. There are 3 image analysis methods for quantifying cytopathic effects, including the destruction of cell monolayer, reduction in host cell count, and morphological changes at an individual cell level.
1. Measure the host cell monolayer using confluence application
The pseudo-green color shows where cells are present, and that area is quantified and compared between different viral treatments.
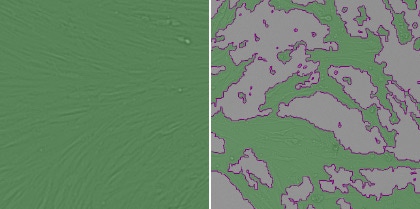
Healthy cells (left) and infected cells (right)
2. Count the total number of cells in each well
The green outlines identify the counted cells in the well. Cytopathic effects will be indicated here by an overall reduction in the number of cells.
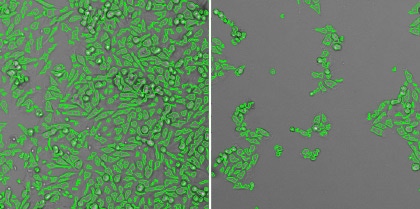
Healthy cells (left) and infected cells (right)
3. Measure the morphological changes of the host cells
The aspect ratios are measured from the counted cells to quantify the morphological changes. The rounding up of the host cells can be an indication of cells dying and this difference in morphology from the healthy cells can be quantified.
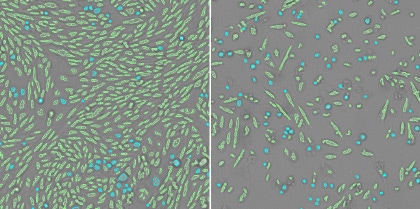
Healthy cells (left) and infected cells (right)
Morphology analysis using Celigo Image Cytometer
Morphological quantification can be conducted using the gating function in the Celigo software to specifically identify cells of different sizes, smoothness, aspect ratio, mean and integrated intensities.
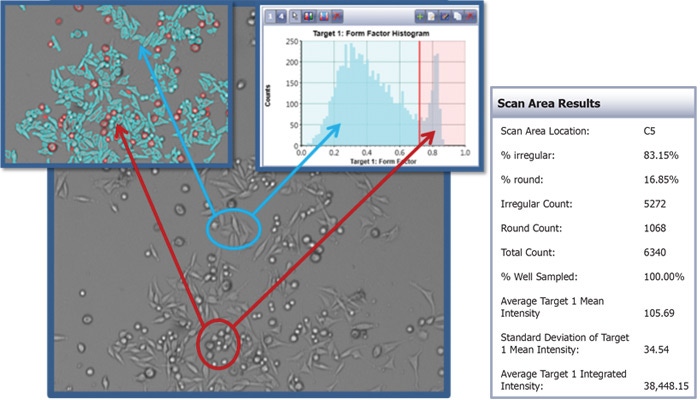
Example image analysis using the gating function in the Celigo software to identify rounded and elongated cells
Cytopathic effect on Vero Cells caused by SARS-COV-2
Below is an example of Vero cells infected by SARS-COV-2 for 48 hours, which show a loss of monolayer and rounding and swelling.

Cytopathic Effect Induced by SARS-CoV2
Brightfield imaging of the cytopathic effect induced by SARS-CoV2 shown in a plate fixed 48h post-infection. All three image analysis algorithms can be applied to the experiment. Shown left to right, Confluence Analysis: loss of monolayer area, Cell Count Analysis: loss of cells, High-contrast and Round Cell Count: infected cells showing cytopathic effects.
General cytopathic effect assay protocol for analyzing confluence percentages between positive and negative samples of cytopathic effect
- Seed the host cells in microplates and allow to incubate and adhere overnight
- Host cells are inoculated with positive control (virus) and negative control (medium)
- The microplates are scanned and analyzed multiple times using Celigo in a time-course manner
- The cytopathic effects are quantified using host cell confluence % measurement
- Cytopathic effect results are directly reported in the Celigo software
For research use only. Not for use in diagnostic procedures.


