Introduction
Therapeutic proteins, namely antibodies, are growing in importance in many drug discovery pipelines. Since the last decade, many therapeutic antibodies were approved by the FDA (Table 1)1.
| Antibody | Brand Name | Type | Indication |
|---|---|---|---|
| Abciximab | ReoPro® | chimeric | Cardiovascular disease |
| Adalimumab | Humira® | Human | Auto-immune disorders |
| Alemtuzumab | Campath® | humanized | Chronic lymphocytic leukemia |
| Basiliximab | Simulect® | chimeric | Transplant rejection |
| Bevacizumab | Avastatin® | humanized | Colorectal cancer, Age related macular degeneration |
| Cetuximab | Erbitux® | chimeric | Colorectal cancer, head and neck cancer |
| Certolizumab pegol | Cimzia® | humanized | Crohn's disease |
| Daclizumab | Zenapax® | humanized | Transplant rejection |
| Eculizumab | Soliris® | humanized | Paroxysmal nocturnal hemoglobinuria |
| Efalizumab | Raptiva® | humanized | Psoriasis |
| Gemtuzumab | Mylotarg® | humanized | Acute myelogeneous leukemia |
| Ibritumomab tiuxetan | Zevalin® | Murine | Non-Hodgkin lymphoma |
| Infliximab | Remicade® | chimeric | Several autoimmune disorders |
| Muromonab-CD3 | Orthoclone® OKT3 | Murine | Transplant rejection |
| Natalizumab | Tysabri® | humanized | Multiple sclerosis and Crohn's disease |
| Omalizumab | Xolair® | humanized | Allergy-related asthma |
| Palivizumab | Synagis® | humanized | Respiratory Syncytial Virus |
| Panitumumab | Vectibix® | Human | Colorectal cancer |
| Ranibizumab | Lucentis® | humanized | Macular degeneration |
| Rituximab | Rituxan®, Mabthera® | chimeric | Non-Hodgkin lymphoma |
| Tositumomab | Bexxar® |
Murine | Non-Hodgkin lymphoma |
| Trastuzumab | Herceptin® | humanized | Breast cancer |
Table 1. Example FDA approved therapeutic monoclonal antibodies
Many laboratories developing and producing antibodies still rely on traditional enzyme-linked immunosorbent assay (ELISA) to perform clonal selection and characterization despite the fact that this proven technology often suffers from lack of sensitivity and reproducibility due to its heterogenous nature. While being responsible for these limitations, the numerous wash and blocking steps required to perform ELISA assays makes them particularly difficult to automate. This process suffers from low throughput; therefore, potential high affinity and selective antibodies can be missed.
Over the years, Alpha technology (i.e. AlphaScreen™ and AlphaLISA™) became an established detection technology in many academic and industrial laboratories. Alpha Technology is homogenous and non-radiometric with distinct features that make it enabling in comparison to other proximity assays. These features include high sensitivity, reproducibility, robustness and large distance for proximity.
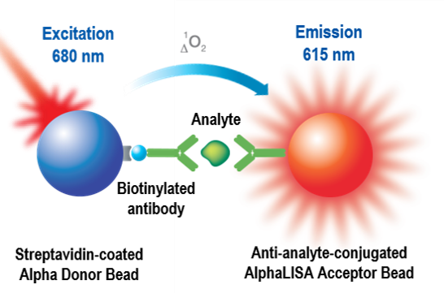
The latter is allowed by a unique mode of energy transfer prevailing between Donor and Acceptor beads based on singlet oxygen. Singlet oxygen lifetime allows this molecule to travel up to 200nm in solution before decaying to its ground state, hence an unsurpassed equivalent distance for proximity. Such large distance for proximity allows one to capture very large molecules and study intractable interactions while using either simple or complex assay configurations, a task which is often difficult to accomplish using other popular homogeneous proximity technologies such as TR-FRET.

Figure 1. Principles of AlphaLISA immuno-sandwich assays. Streptavidin-coated Donor beads are used to capture a biotinylated antibody specific to a precise epitope present on the analyte. Another antibody, also specific to an epitope found on the analyte, is directly conjugated to the Acceptor beads. Both the Donor and Acceptor beads are brought into proximity in the presence of the analyte. An AlphaLISA signal, directly proportional to the concentration of the analyte in solution, is then generated after laser excitation at 680 nm.
Based on the benefits listed above, Alpha technologies represent powerful means of detecting and characterizing a wide range of proteins, namely antibodies. An extensive toolbox was thus developed for this purpose. This toolbox includes various beads coated with a series of anti-tag antibodies, anti-species antibodies and other generic capture proteins such as protein A and protein G. Using these tools, researchers are now capable of converting their traditional ELISAs into more sensitive, reproducible and higher throughput assays; therefore, facilitating therapeutic protein discovery and characterization.
The following review will describe how Alpha technologies can be used to enable antibody selection and characterization.
Antibody clonal selection
Vainshtein et al.2 used AlphaScreen to improve the automation of the antibody clonal selection process and then speed up the discovery of the best IgG clones (Figure 2). Using AlphaScreen toolbox reagents, the authors developed a broad variety of applications for hybridoma fusion screens, serum titers and antibody quantifications. Competitive immunoassays were also performed to determine the affinity of the IgG clones identified during screens. The authors state that AlphaScreen proved to be more sensitive than ELISA and allowed for identification of a larger number of hits. Miniaturization and the homogeneous nature of the assay simplified the workflow, significantly shortened assay run time, and made the screening operations more cost-effective.

Figure 2. To perform hybridoma screening, Vahnstein et al. used anti-human IgG Fc coated Acceptor beads and Streptavidin coated Donor beads to capture a biotinylated derivative of the target antigen of interest. In the presence of antibodies specific to that antigen, both beads are brought into proximity and a robust AlphaScreen signal is emitted.
The authors also compared the performance of AlphaScreen to that of ELISA during hybridoma screening (Figure 3). A total of 148 samples were screened: 23 and 55 positives were identified with ELISA and AlphaScreen respectively. Interestingly, all ELISA hits were a subset of the Alpha hits. AlphaScreen identified more hits due to higher sensitivity due to the detection of low affinity antibodies.

Figure 3. Hit Comparison between ELISA and AlphaScreen. Due to its higher sensitivity, AlphaScreen generated more hits.
Measuring antibody affinity
Performing molecular biology re-engineering allows one to modify antibody Fc or Fab sequences to enhance their specificity and/or affinity to their targeted antigen. Using a combination of computational structure-based protein design methods coupled with high-throughput protein screening, Lazar et al.3 modified Fc sequences of human IgGs to obtain higher affinity antibodies binding to Fcγ receptors. Affinity of the resulting Fc variants were estimated with AlphaScreen in competition assays where a biotinylated derivative of the parent antibody (trastazumab) was used as the tracer.
It is worth mentioning that competition assays are the best means to measure affinities with AlphaScreen. As predicted by the Cheng & Prusoff4equation, when both proteins used as tracers and targets are used in negligible concentrations compared to their putative Kd values, IC50 values obtained from competition assays will closely match the Kd. Affinities obtained with AlphaScreen closely matched those estimated with Surface Plasmon Resonance (SPR).
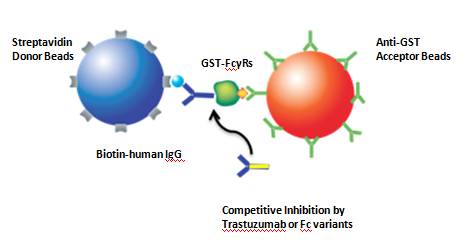
Figure 4. To measure the affinity of different IgG clones bearing Fc variants, Lazar et al. developed a competition assay using biotinylated human IgG as a tracer. Anti-GST coated Acceptor beads are used to capture recombinant Fcγ receptors expressed as GST-fusion proteins. In absence of Fc variants (yellow colored heavy chain), biotinylated human IgG binds to its receptor so both the Donor and Acceptor beads are brought into proximity to produce a signal. In the presence of increasing Fc variant concentrations, a progressive signal decrease is observed.
Using AlphaScreen, the authors identified and characterized a series of Fc variants with optimized Fcγ receptor affinity and specificity. These variants showed more than 2 orders of magnitude enhancement of in vitro effector function. They were efficacious against cells expressing low levels of target antigen, therefore producing increased response in an in vivo preclinical model. Re- engineering Fc regions offer a means to improve therapeutic antibodies and have the potential to broaden the diversity of antigens that can be targeted for antibody-based tumor therapy.
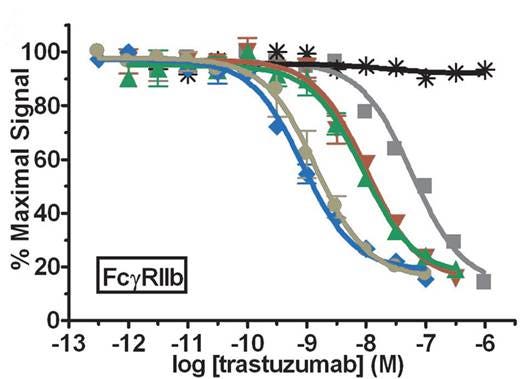
Figure 5. Examples of Fc variant competition isotherms on FcγRIIb receptors. Black asterisk, buffer; gray squares, WT; black diamonds, S298AE333AK334A; green triangles, S239D; red inverted triangles, I332E; blue diamonds, S239DI332E; and tan circles, S239DI332EA330L.
Selecting & Matching antibody pairs for immuno-sandwich assays
Careful antibody selection is mandatory to select the best pair to produce highly sensitive and selective sandwich immunoassays. The identification of pairing antibodies is a tedious and labor-intensive process. Using protein A coated Donor and Accceptor beads, Bembenek et al. developed a robust and high-throughput method for identifying pairing complementary antibodies derived either from commercial sources or identified during a rabbit hybridoma monoclonal screening5. This group demonstrated the value and effectiveness of their assay with different protein targets, including: Akt2, ATF3, and NAEβ (the β-subunit of the neddylation activation enzyme).
Using a matrix approach, the authors systematically tested a wide range of antibody samples against each other by pre-coating them on both Donor and Acceptor beads (Figure 6). To make sure that the beads were optimally loaded with antibodies, saturating amounts of commercial IgGs or hybridoma supernatants were mixed with beads. Beads were then centrifuged and washed multiple times to remove unbound antibodies.
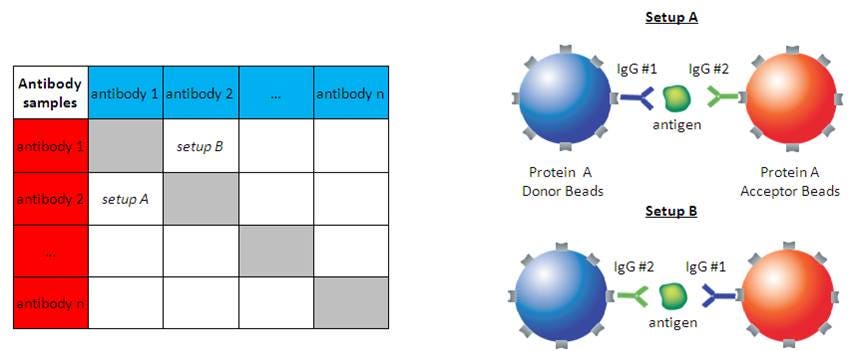
Figure 6. Left: Antibody samples (hybridomas) were tested in pairs using a matrix approach. Right: Protein A coated Donor and Acceptor beads were first pre-loaded with distinct antibody samples. Each antibody combination was tested on both Donor and Acceptor bead to find the optimal assay configuration (i.e. setup A or B). Gray shaded boxes represent assay setups where the same antibody is found on both Donor and Acceptor beads. When the antibody sample is of monoclonal nature, no significant antigen capture is possible and therefore only background signal is measured.
Representative matrix design for 18 positive anti-NAEβ rabbit monoclonal antibody-producing hybridoma clones is shown on Figure 7. Results represent averages of duplicate samples with complementary antibody pairs. Positives are highlighted in yellow boxes while the same antibodies tested against themselves are highlighted in gray along the diagonal. The average background values obtained across the entire matrix in the absence of antigen was approximately 1000 counts. In that example, clones 18 and 81 were those allowing for the most efficient antibody pairing. Based on total counts (155,000 cps), the best setup was obtained when clones 87 and 81 were immobilized on Donor and Acceptor beads respectively. Interestingly, only 60,000 counts were generated when the same antibodies were switched from Donor to Acceptor beads and vice-versa. Difference in levels of protein A conjugation or antibody capture capacity between the Donor and the Acceptor beads may account for the difference.
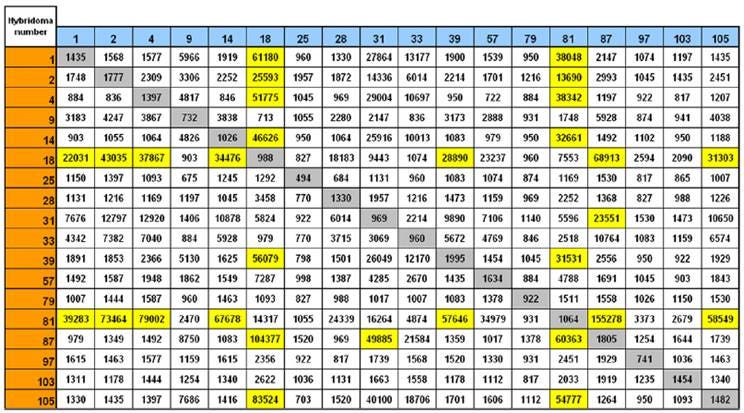
Figure 7. Representative matrix design for 18 positive anti-NAEβ rabbit monoclonal antibody-producing hybridoma clones.
Utilizing and characterizing antibodies present in complex matrices
During the course of antibody development, the detection and characterization of specific clones is complicated by the presence of non-specific antibodies. This is the case for polyclonal antibodies generated in animals where only a very small proportion of the antibodies present in serum samples are specific to an antigen of interest. Sometimes, monoclonal antibodies also represent a very minor proportion of specific antibodies in ascites fluids.
The ELISA technique allows one to isolate and characterize clones of interest by immobilizing the antigen of interest onto the surface of a solid matrix (i.e. gel or microplate). After a series of blocking and wash steps, non-specific antibodies are washed out leaving specific antibodies bound to the solid support and available for subsequent detection. Once again, this process suffers from low throughput and potential high affinity, and selective antibodies can be missed if a sufficient amount of samples can’t be screened.
To speed up the characterization of low abundance antibodies in serum samples, Poulsen et al. developed a semi-homogenous approach using AlphaLISA6. As shown in Figure 8, a five-step protocol was developed and performed as follows:
- Acceptor beads conjugated with antibodies specific to the analyte of interest are first immobilized onto the wells of “high binding” capacity microplates
- Antigen samples are then added followed by a single wash step.
- The antibody to characterize and present in a complex matrix (i.e. serum, ascites) is added followed by another single wash step.
- Donor beads conjugated with an antibody (or any other binding protein) specific to the antibody to characterize are finally added.
-
Microplates are incubated and read
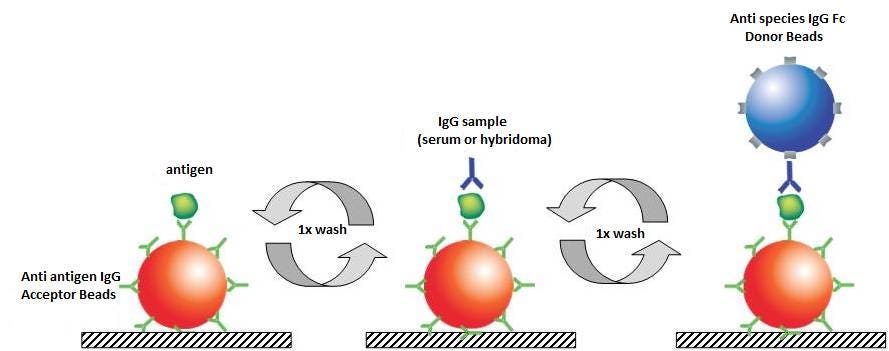
Figure 8. AlphaLISA semi-wash assay configuration used by Poulsen et al. to characterize low abundance antibodies present in serum samples.
As shown in Figure 9, the semi-wash AlphaLISA protocol allows one to detect low levels of specific antigens using unpurified primary IgG preparations from serum or hybridoma. In this specific case, Insulin was detectable with a LOD of 0.3 pM while the standard homogeneous protocol was less sensitive; allowing one to detect Insulin with a LOD of 50 pM.
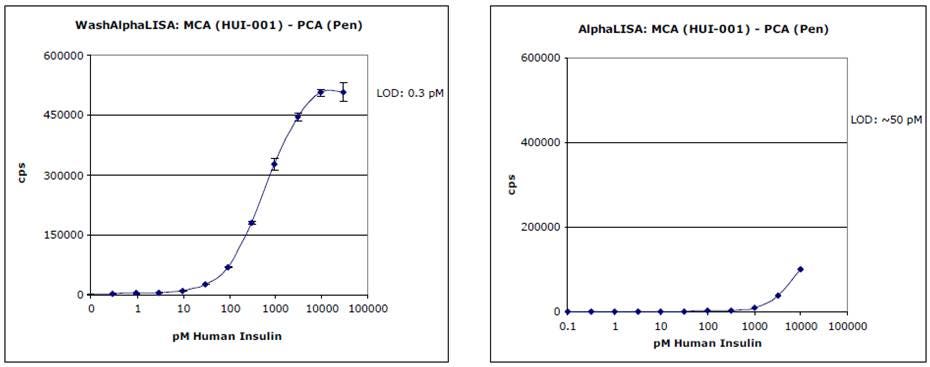
Figure 9. Characterization of an unpurified polyclonal antibody against insulin (PCA-Pen) using AlphaLISA. The performance of the AlphaLISA semi-wash protocol (wash AlphaLISA, left panel) was compared to that of the standard homogeneous AlphaLISA protocol (right panel). The semi-wash protocol allowed for a better performance compared to the standard protocol: key parameters such as the lowest limit of detection (LOD) and dynamic range were improved by at least 2 orders of magnitude.
Performing semi-wash assays with Alpha technologies is one way to expand their use and versatility. Polyclonal antibody preparations with low content of specific IgG may be characterized without affinity. Alpha assays developed with this alternative still show broad dynamic range and excellent sensitivity while no hook effect due to antigen oversaturation is observed. It is worth mentioning that Alpha homogeneous and semi-wash assays can be run with exactly the same reagents and equipment (liquid handler and reader).
Summary
Antibodies represent an emerging class of therapeutic drugs and clinical tools. Higher throughput and more sensitive technologies are needed to speed up antibody selection and characterization. The versatility of AlphaScreen and AlphaLISA makes these technologies very appropriate to detect, measure and characterize antibodies present in different matrices.
Using AlphaScreen or AlphaLISA reagents, scientists showed that the antibody clonal selection process could be significantly improved. Other groups used competitive immunoassay setups and demonstrated that it was possible to determine antibody affinities with values closely matching those obtained using SPR. Using Alpha toolbox reagents7, straightforward protocols were developed to select and match antibody pairs for immuno-sandwich assays. Alternate semi-wash protocols were also designed to utilize and characterize antibodies present in complex matrices such as serum or ascites fluid, expanding the usability of Alpha technologies further.
References
- Waldmann, TA. Immunotherapy: past, present and future. 2003; Nature Medicine 9 (3) 2: 269–277.
- Vainshtein I, Kurose S, Vickroy J, Russell Grove J, Liang M. Fast and Efficient Soluble Antigen-Antibody Screening Using Homogeneous AlphaScreen Assay. Poster Presentation. SBS 11th Annual Conference. September 2004, Orlando (USA).
- Lazar GA, Dang W, Karki S, Vafa O, Peng JS, Hyun L, Chan C, Chung HS, Eivazi A, Yoder SC, Vielmetter J, Carmichael DF, Hayes RJ, Dahiyat BI. Engineered antibody Fc variants with enhanced effector function. Proc Natl Acad Sci U S A. 2006 Mar 14;103(11):4005-1.
- Cheng Y, Prusoff WH. Relationship between the inhibition constant (K1) and the concentration of inhibitor which causes 50 per cent inhibition (I50) of an enzymatic reaction. Biochem Pharmacol. 1973 Dec 1;22(23):3099-108.
- Bembenek ME, Burkhardt A, Ma J, Li Z, Loke HK, Wu D, Xu Q, Tayber O, Xie L, Li P, Li L. Anal Biochem. Determination of complementary antibody pairs using protein A capture with the AlphaScreen assay format. 2011 Jan 15;408(2):321-7.
- Poulsen F. “Wash AlphaLISA” - An Extension of the AlphaLISA/LOCI Technology. Revvity Technology Forum – University of Copenhagen, Denmark October 6th 2010.
For research use only. Not for use in diagnostic procedures.
The information provided above is solely for informational and research purposes only. Revvity assumes no liability or responsibility for any injuries, losses, or damages resulting from the use or misuse of the provided information, and Revvity assumes no liability for any outcomes resulting from the use or misuse of any recommendations. The information is provided on an "as is" basis without warranties of any kind. Users are responsible for determining the suitability of any recommendations for the user’s particular research. Any recommendations provided by Revvity should not be considered a substitute for a user’s own professional judgment.


